About three months ago I wrote a post called The Two Most Poisonous BPR Dangers, in which I talked about why you shouldn’t necessarily design processes with the “lowest common denominator” in mind.
My argument was that if you demand perfection in the output of your processes, you’ll pay for it in terms of (amongst other things) unnecessary checks and rework embedded within the process itself.

Recently I’ve been taking a project management course at Mount Royal University here in Calgary, and one of my classes featured a little nugget of wisdom that was initially very surprising to me, and then immediately familiar. In short, it was something that should have been obvious to me all along. Nevertheless, it wasn’t something that I realized until somebody explicitly broke it down for me, and in case you’re in the same boat, allow me to pass on the favour to you.
Can you ever have too much quality in the output of your process? Yes you can, and I’m about to use actual math to explain why. Brace yourselves, and join me after the break.
Prevention vs. Cure
Conventional wisdom will tell you that the cost of preventing mistakes is lower than the cost of correcting them after the fact. Our goal in this story is lower costs, so extending that logic out would suggest that the way we optimize costs would be to demand perfection from our processes, right? Prevention is better than cure, so with 100% prevention of defects we don’t have to do any of that expensive fixing of things after the fact.
Actually though, this is not the case – it depends on how you frame things. Let’s imagine our process is a manufacturing one, and we’re producing widgets. The cost of making a single good widget and delivering it to our customer is certainly lower (and probably significantly so) than the cost of inadvertently producing a bad widget that gets shipped. If that unhappy process path is followed then now our customer service team needs to be engaged, the bad widget needs to be shipped back, and a replacement good widget sent out. All that stuff is expensive. Just think how much money we’d save if we didn’t have to go through all that rigmarole.
Here’s why this is too much of a simplification, though: we’re not making a single widget here, we’re making thousands, maybe millions of them. We can’t view our process only in terms of producing that single widget, we have to see this process how it is: something that’s repeatable time and time again, with each execution of it featuring some probability of producing a defect.
The Cost of Preventing Mistakes
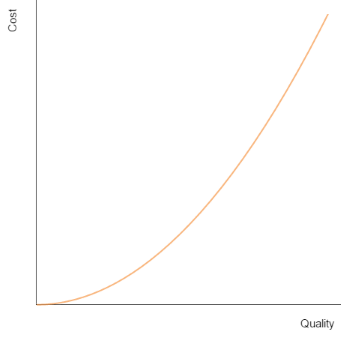
Broadly speaking, the cost of preventing mistakes looks like this:

As we move closer to 100% quality in our process, costs start to rise exponentially.
This makes intuitive sense. Let’s say our widget producing processes are resulting in a happy outcome just 25% of the time. That’s very bad, but we can be optimistic! There’s at least much we can do about it – we could improve the machinery we use, we could add an inspector to pick out the bad ones and prevent them from reaching our customers, in fact almost any adjustment would be better than maintaining the status quo. Essentially there’s lots of low hanging fruit and we can likely make substantial improvements here without too much investment.
Now let’s say our production processes result in a happy outcome 99.9% of the time. We’re probably achieving this because we already have good machinery and an inspection team. How do we improve? Do we add another inspection team to check the work of the first? And a third to check the work of the second? Perhaps we engage the world’s top geniuses in the field of widgetry to help us design the best bespoke widget machinery imaginable? Whatever we do is going to be difficult and expensive, and once it’s done how much better are we really going to get? 99.95% quality?
This is the argument I was making in my previous post. Would further improvement here be worth it from a cost/benefit standpoint? It’s highly doubtful, but we’ll get to the answer soon!
The Cost of Fixing Mistakes
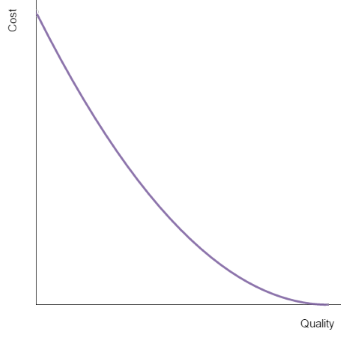
The cost of fixing mistakes looks a lot like this:

This makes intuitive sense too. As we move closer to 100% quality, the cost of fixing mistakes shrinks to nothing – because at that point there are no mistakes to fix.
Down at the other end of the chart on the left, we have problems. Back in our widget factory with a happy outcome 25% of the time, three quarters of our customers, upon receiving their widget, are finding it to be defective. They’re calling our customer service team, and asking for a replacement. Those guys are tired and overworked, and even once they’ve arranged for the defective widget to be returned there’s still a 75% chance that the replacement will be defective too and they’ll be getting another call to start the whole thing over.
Finding the Optimal Balance
In our version of the widget factory with a 99.9% happy outcome, things would seem pretty rosy for the business. There’s barely any demand on our customer service folks. We probably have just the one guy manning our 1-800 number. Let’s call him Brad. Brad’s work life is pretty sweet. He probably spends most of his day watching cat videos on YouTube while he waits around for the phone to ring.
If we were to spend the (lots of) money needed to increase quality to 99.95%, we’d probably still need Brad. He’d just get spend even more of his time being unproductive. We’d save some money on shipping replacement widgets, but really there’s very little payoff to the higher quality we’re achieving. We’ve managed to get ourselves into a position where conventional wisdom is flipped on its head: the cost of fixing a problem is less than the cost of preventing one.
This same construct applies to any process, not just manufacturing. So where, as business process engineers, do we find the balance? Math fans have already figured it out.

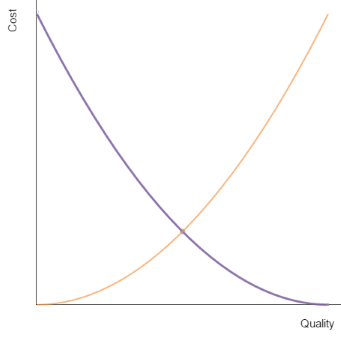
Cumulatively, costs are at their lowest where the two lines meet – where the money we spend on preventing mistakes is equal to the money we spend fixing them. For me this was the thing that was initially surprising, but should have been obvious all along. It seems so simple now, right?
Well, it isn’t. Determining where that meeting point actually falls is no easy task, but nevertheless the moral here is that as much as we all want to strive for perfection it actually doesn’t make business sense to achieve it! We should keep striving, because in reality the meeting point of the two lines on the chart is further to the right than the simplistic graph above might suggest – prevention is, as everybody knows, less expensive than cure and conventional wisdom exists for a reason – but if our strive for perfection comes at the exclusion of all else, if we refuse to accept any defects at all? Then we’re doing it wrong.